Our client, a leading construction firm in the state of Georgia, USA, needed a cost-effective solution for tracking the construction progress of >300 single-family units.
This case study shows how we used our Power BI expertise to visualize the construction progress of the units, but it also shows how Power BI alone wasn’t enough - and how we built an end-to-end system that achieved our client's goal, from data creation to data visualization.

Our client was already using construction management software. They were too big not to use one.
The problem?
The software wasn’t tailored to this use case, it didn’t have mobile support and no reporting capabilities. They also looked into alternatives but didn’t find anything ready-made that they could use.
This resulted in:
After careful assessment, we found out that It wasn't just about tracking the on-site progress and project-related costs.
Our client needed a way to track progress over time and compare it with the schedules.
To solve this, we needed a detailed system to track every change users made in the application.
We figured out we needed two technologies for the job:
After detailed discussions and considering our client's requirements, we decided to build an application that would have four tables.
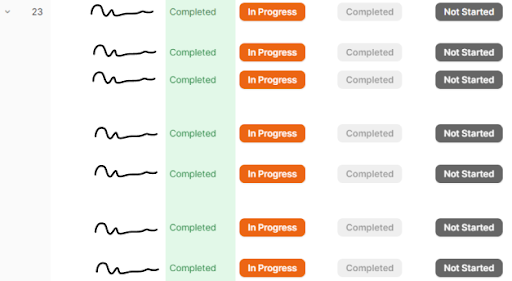
Complete Site Management in Coda: The system in Coda allows users not only to view the current status of tasks but also allows for easy management of all tasks, units, and costs, creating a digital copy of the construction site.
Scalable Operations: Our client can manage projects of any size with ease, as our application handles over 20,000 tasks across 350 construction lots, showcasing its scalability and adaptability.
Interactive Site Work Map: We also used the project's site work sketch to create a map that allows for tracking work progress, giving the constructor a clearer picture of the project's evolution.
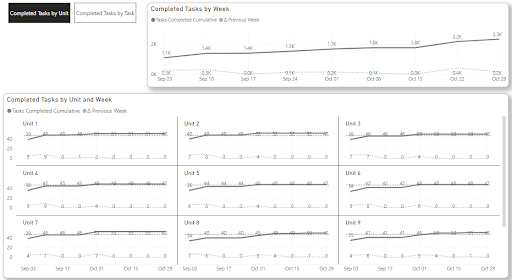
Proactive Progress Tracking: Our application, powered by Power BI:
No fancy talk. Just real results:
A bunch of companies talk about data solutions, but Datanauts actually delivered.
Our construction projects were stuck in paperwork hell until they showed up. Their no-nonsense approach cut through the clutter, transforming our paperwork chaos into streamlined processes.

După o analiză atentă, am realizat că avem nevoie de trei tehnologii:

Din perspectiva cerinţelor clientului nostru, Power BI a fost perfectă pentru vizualizarea datelor, în timp ce Coda a fost perfectă pentru construcţia aplicaţiilor.
Cu toate acestea, ne lipsea un element deosebit de important – o manieră uşoară de a transfera datele de la Coda la Power BI.
Aceasta a condus la Marea întrebare: Cum stabilim o conexiune între Coda şi Power BI?

Pe scurt, rezolvarea noastră a fost printr-un „Mecanism de transfer de date”, utilizând API Coda şi Google Sheets AppScript.
Rezultatul? Colectarea orară a datelor în Google Sheets, construind o legătură invizibilă dintre Coda şi Power BI.
Şi încă nu am terminat – utilizând aplicaţia Power BI, am reuşit să prezentăm aspecte vizuale ce înlesnesc urmărirea uşoară a progresului vertical (în funcţie de unitate) şi orizontal (în funcţie de sarcini).

Întreaga interfaţă este proiectată pentru a fi interactivă, transparentă şi uşor de utilizat.
O altă realizare care se evidenţiază reprezintă crearea unei hărţi interactive a şantierului.
Utilizând schiţa şantierului, am construit o hartă pentru monitorizarea fiecărui cm de progres realizat de noi. Aceasta a oferit constructorului o imagine limpede asupra direcţiei proiectului, îmbunătăţind luarea deciziilor şi managementul proiectului.

